Built-in statistics in Streamio
In Streamio, you can easily publish video as well as live stream. Seeing statistics for how many people have watched your content is just as easy! Note that the internal statistics require the use of Streamio’s own players. If you use an external player, these views will not be reported in Streamio’s internal statistics. For those who require more advanced statistics, there’s a guide here on how to link to Google Analytics,and one here for how to link to Matomo, the GDPR-safe alternative to Google Analytics.
Statistics for the entire account
In the “ANALYTICS” section you will find clear and relevant statistics/analytics for your videos.
Here you can see statistics for both the entire account and for individual videos. Select the Account, Videos, Live or Consumption tab for each statistics section.
Account – Statistics for different channels
If you have posted videos to various social channels, such as YouTube, Twitter, Facebook or LinkedIn, you will also see a complete and compiled statistics from each channel collected in one place.
Select for which time period you want to see aggregate statistics across your entire account. You choose from:
- Last 24 hours – Past day
- Last 7 days – Past week
- Last 30 days – Last 30 days from today’s date
- Current period – Current calendar month
- Previous period – Previous calendar month
- Date-month-year – The month before the previous calendar month
It is now also possible to select statistics for previous months and years.
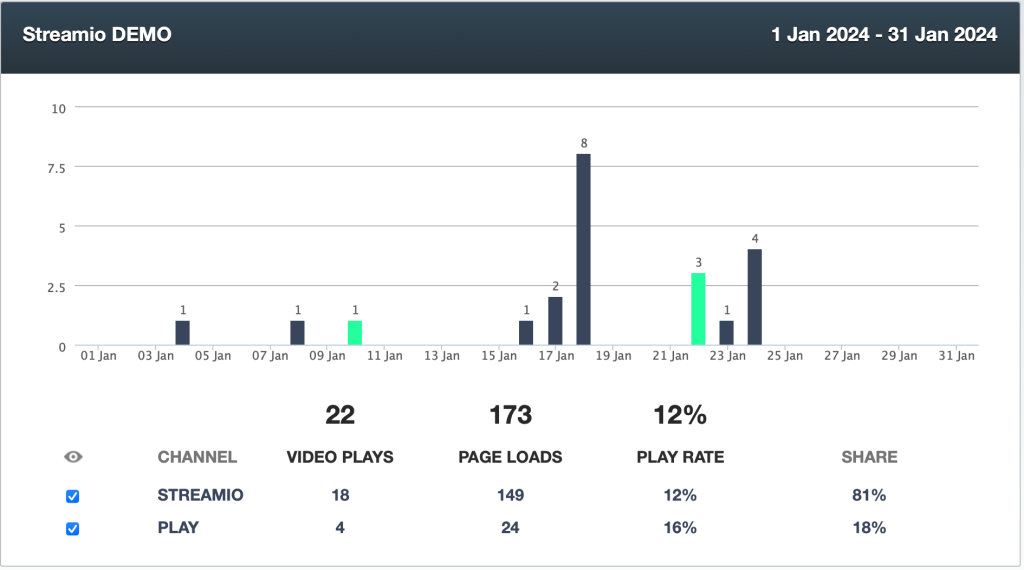
During each time period, you will find information about:
- Video plays – Total number of times visitors watched your movies
- Page loads – Total number of times the player has been loaded/viewed
- Play rate – Total number of times unique and non-unique visitors watched all your video
- Viewing frequency– What percentage of the total number of visitors to all pages saw your video
- Share – The respective channel’s share of the total number of plays
Account statistics. Check off or on channels in the table below the chart to see the respective bars in the corresponding color.
Hover your mouse over a bar to see the viewing frequency of a single channel. Hover over each channel’s colored part of the bar to see information.
Video stats
In addition to the time period, under the Video tab, you can choose how you want to sort the list of videos. Choose between sorting the videos by:
- Most recent created Video
- Oldest video
- Alphabetical order
- Most viewed Video of the selected time period
- Largest
- Smallest
- Uploader
Select period, sorting, and filtering for videos
It is also possible to filter the selection by the specified tag, Select tag in the Filter by tag list. You can also perform a free text search for a specific video.
Note! If you want more control of the time periods of your statistics, we recommend linking Google Analytics or Matomo to players.
Videos all-time high
If you want to know which video is the most watched, regardless of your time period, you choose to sort your movies under Library – Videos by “Most Viewed.”
Detailed information
To get detailed information about a particular video, click anywhere on the video line.
As with your entire account, you can choose from which channels you want to see statistics. Similarly, information about:
- Video plays
- Page loads
- Play rate
- Share of the Respective Channel
If you want more detailed statistics about your videos and also get statistics further back in time, you can also link your video player to Google Analytics for event tracking.
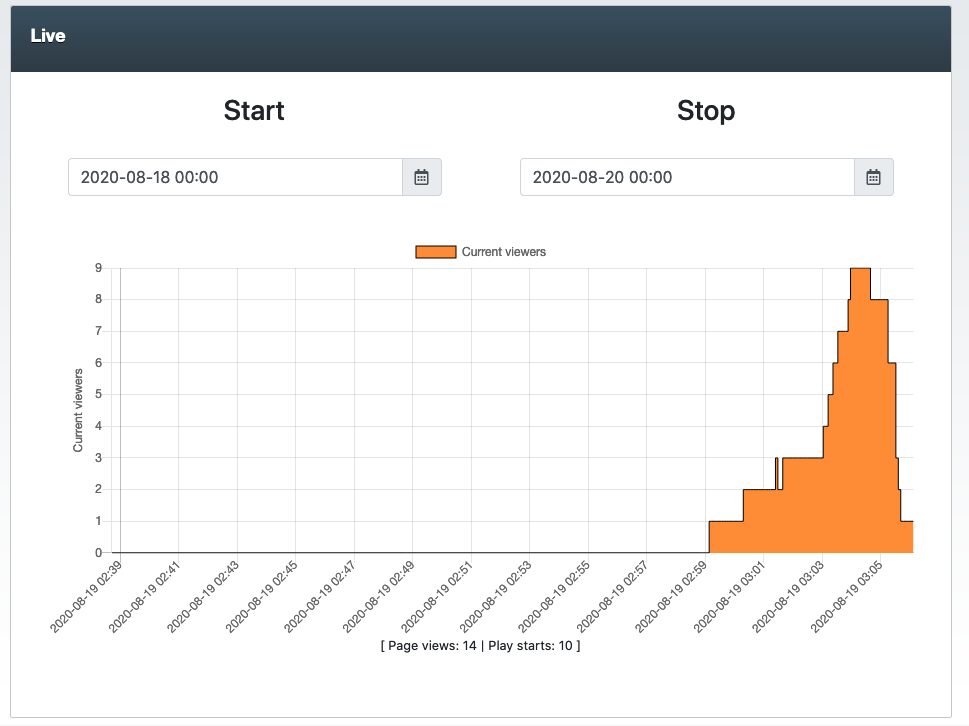
Live stats
In real time, the statistics for your live streams are updated. Under the “Live” tab, you can see how many people are watching an active live stream, as well as go back three months in time to see statistics for previous live streams.
The graph is updated automatically and can be separated by time and date. Below the graph, the number of page views with the player embedded is displayed, this applies to both views on pages where you have embedded iframe code, visits to the card link player or visits to Play channels that show the live stream.
Here we also see a summary of the number of starts, which may differ from the graph when the graph shows the number of concurrent viewers while the number of starts shows the number of total video starts.